For this provide a ``sign up'' option on the login form. Ensure that there is no already registered user with the same login name.
There will be no login.txt file provided for user names and passwords (as was the case in assignment 3).
Provide a ``cancel'' button on the login form and a logout button on every form other than the login form.
2.1 The first time user logs in, user should be presented with a form for conducting survey.
The form will be having fields like
hockey,
football,
volleyball,
cricket.
User will grade himself/herself on a scale of 0-10 on these fields. Show the fields on the form with labels and allow the user to choose a grade from comboboxes having values from 0-10.
This is just one example of fields. Actually the name of the fields, the form will show, will be stored in some table in the database. Your program will search the table and will display appropriate fields. Thus the form needs to be dynamically generated. You can assume that the scale will always range from 0 to 10.
Store the values entered by the user in database so that it can be included in analysis of data.
To change the fields in the database provide an an admin user, who when logs in is provided with a ``Create survey'' form with a textarea in which he can enter names of the fields(one on each line). Your program will then delete and create appropriate tuples in the table containing fields.
The look and feel of the data gathering form should depend on a configuration file(say dataForm.cfg). An example dataForm.cfg may contain
title 'Data Gathering Form'
bkgndColor 808080
buttonColor CFCF88
wndSize 380 500
btnSize 20 60
here 808080, CFCF88 represent color value in hexadecimal rgb format. 380 550 represent height and width of window in pixels and alike.
The color and size related keywords shown above are compulsory. You can choose upon 3 other keywords and values yourself. Put the description about what keywords and values are legal in the README file. Provide atleast 3 new keywords.
After this the user should be presented with a new form (for analyzing data) as described in 2.2.
2.2 Every time a user logs in other than the first time, user should be presented with a form for analyzing data gathered by the survey.
The form will be having the same fields as there were in the data gathering form. But this form should allow the user to select fields and the values or ranges for values of those fields that will determine which records will be considered for purpose of analysis.
Like for the above example the user may want to select
field hockey with values ranging from 5-8
and
field cricket with values ranging from 2-4
For this provide a checkbox for each field that will determine whether the field needs to be considered or not.
And for each field provide a pair of comboboxes to select the range of values for that particular field. Put appropriate checks like the selected range start should be less than selected range end.
Use "dialog boxes" to display error messages to users everywhere.
You can display the results of above analysis in a listbox or directly on some form (form here does not mean something like html form, that will be having fields for taking input from the user). In any case the results should be internavigational.
For example if user clicks on some user's hockey value in the result (assume it to be value 6), then the form should display all users with hockey value 6. (You will have to track mouse events for this).
Every form displayed in 2.2 should have a button labeled ``Graphical Analysis'' (explained in 3).
- Bar chart
- Pie chart
- Scatter diagram
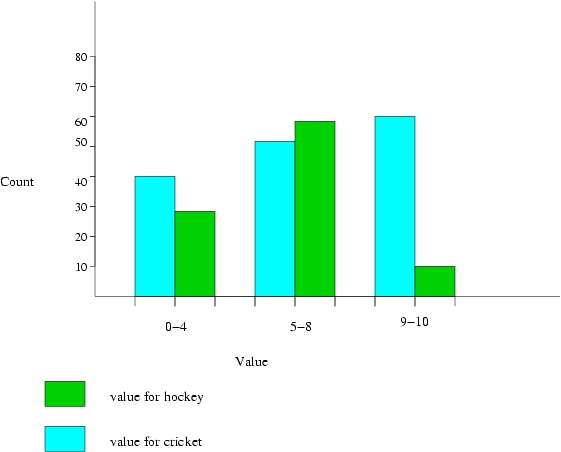
- If Bar chart radio button is selected - provide a check box group with fields of 2.1 as
labels of the check boxes. A selected check box for a particular field means that the values
corresponding to the field will be taken into consideration while drawing the bar chart.
Apart from these checkboxes, add a combobox (with values ranging from 1-10) that will decide
in how many bars the values for a particular fields will be divided. The values will come on x-axis
and count of results will be on y-axis.
For example if the user has selected checkboxes corresponding to football and hockey and selected 3 as the value in combobox the results will be like as shown below.
- Pie chart - provide a group of radio buttons corresponding to fields of 2.1. This will specify
on which field's values to create the pie chart. Add a combobox with values 1-10 that will be
used to decide in how many sectors the pie chart will be divided.
For example if the value selected in combobox is 2, values for the field will be divided into two groups 0-5 and 6-10, and according to their count the pie chart will be displayed. - If Scatter diagram radio button is selected - provide two group of radio buttons corresponding
to fields of 2.1. First group's values will correspond to x-axis and other group's values will
correspond to y-axis. For each user a point will come in the scatter diagram positioned according
to the user's values in the selected two fields. Ensure that same field is not selected in both
the group of radio buttons.
Add a button labeled ``Show results'' on this form, which when clicked will show the appropriate graphics in some new form. The graphics form should have an option to move back to Graphical Analysis form.
The above diagrams and graphs should be customizable using a configuration file(say graphicalForm.cfg):
An example graphicalForm.cfg may contain:
- Mode : This will be having two subitems.
- Default mode - switch to form in 2.2.
- Graphical mode - switch to form in 3.
- About - This when selected should show a dialog box having information about this Assignment and the project group members.
bargraph :
width 10
colorOrder red blue yellow green
alignment horizontal
bkgndColor 808080
piechart :
radius 100
colorOrder red blue green yellow
largestSector onRight
scatterdiagram
diameter 2
color black
grid yes
The above keywords are compulsory. You can change the order of the colors. You need to choose upon 2 other keywords (for each of bargraph, piechart and scatter diagram) and values yourself. Put the description about what keywords and values are legal in the README file.
Provide a menu with two main menu items. The menu should be displayed only in analysis form. It should be having two main items.
General Instruction and Deliverables
- For code management and code sharing 'cvs' (concurrent version system) needs to be used.
- Submit only checked out version of the code.
- Instead of 'make' use 'ant'.
- Files which can be generated should not be included.
- A tarred gzipped file named as your groupid.tgz which when extracted creates a directory with your groupid and all files in that directory. The main class name should be your group name, e.g. G23 for group no 23.
- README file containing information about group members, known bugs/limitations and any other information as specified above.
- Java source code for all the classes etc.
- Conf file from where all the parameters are read.
- Schema file(Schema should be static)
- build.xml (used with ``ant'')
- Any other file, if required.
Release Date : Friday, 3rd September, 2004
Submission Deadline : Friday, 24th September 2004, 23:59:59