

Prajakta Ayachit
ROLL NUMBER:09305924
Hit the space bar for next slide
Copyright © 2005-2006 W3C ® (MIT, ERCIM, Keio), All Rights Reserved.
To provide package for drawing flow diagram.This flow diagram is general and be used to draw various diagrams easily.
The command named "mydia" should be used to draw the diagram.This diagram accepts two parameters in curly braces as:
S:Shape of node circular or rectangular
t:Text to be written inside node
l:Text to be written on edge
Triplets should be seperated by comma.
The Tikz diagram generated according to given description. The diagram has given number of nodes. The nodes can be circular or rectangular.The inputed text is written inside each node.The third parameter for each triplet should be text to be written on ege which will be incident onto this node. The placement of nodes is done automatically and assumes circular shape.The default arrow shape is drawn between two nodes as "->".
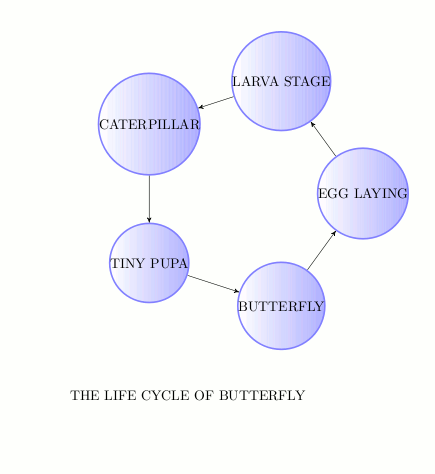
Sample diagram generated:Lifecycle of butterfly is :

Sample line from .tex file to draw diagram:


  \mydia{placep/Process1/,rect/External Entity/,placep/Process2/}{3}
The reasons for selecting this as miniproject are as follows:
So I selected to provide basic command which can be generic enogh to draw such simple diagrams for people in other domains.So diagrams drawn as per requirement can be used while presenting and explaining such concepts.
If we observe various diagrams , the basic elemets which are commonly used are circle and rectangle. To connect them we can use various types of arrows.We can use "->" type of arrow commnly. Also if the aim of diagram is to depict the flow between elements then the way in which they are placed is not critical for consideration. So we can assume that the nodes are placed such that they will form a circle approximately.Considering these things the parameters to be accepted for drawing nodes are decided. Also please note that this diagram is not some domain specific such as theory of computation(automata diagrams),Software engineering(data flow diagrams) but it provides basic framework which can be used as per requirement to draw simple diagrams.
Initially I proposed to draw diagram with following things:
The features currently implemented by command are:
The features which were initially proposed and not implemented by command are:
The dynamicity in number of nodes and placing them as well of providing option for shape of node as circle and rectangle were added later.
Basically I was totally new to Tikz and Latex. So it took 10-15 hours to get familiar with it.
There are many many things for which already library is built and available to use.To find what is already implemented and what can be implemented using that took 5-10 hours.
For actual implementation it took some time.Initially I drew diagram without accepting any parameters from user. Then I tried to draw it for some hard-coded parameters.It took time to understand command "\newcommand" used to define macros . Defining .sty as per our requirement was easy. Using these my commands are defined.
The command used for drawing diagram is \mydia.
Following styles are defined:
Following commands are defined:
It accepts 3 parameters namely:initial value,testing condition,code to be executed when condition is satisfied
In this command for each triplet ,position of node is calculated and nodes are automatically created as X0,X1,X3,...
After that using \forloop command edges are drawn between nodes.
Sequence of calling:
User calls /mydia. That in turn creates nodes and calls /forloop for drawing edges.
No modules as such are borrowed directly.
Following packages are used:
Following libraries are used:
PGF and TikZ manual for Version 2.0
The difficulties were faced when the number of nodes was not fixed. So to place such arbitrary number of nodes calculations were required.This was done by using polar co-ordinates and setteing angle of polar co-ordinate as 360/No of nodes * node number. The node name is generated automatically as X0,X1,....
This naming is useful while connecting nodes.Also defining \forloop resolved the problem of connecting nodes.
So this package can be used to draw simple diagrams depicting flow between entities,actions,objects in various domains such as medical,pure sciences,management,etc and will reduce efforts and save time.
THANK YOU!!!